

Been struggling for a while with high CPU load (0.40) but CPU usage was at best 10%.
Setup
Machine is an Intel Xeon E3-1240 v3, Fedora 26, running on a mdadm RAID 5 array. Including few virtual machines which at one moment I had to move to the RAID, as they would not fit the boot disk anymore.
One of the virtual machines runs Graphite / Carbon, receiving about 600 measurements / minute from the local network. The other two VMs were started, but idling.
Once the number of messages increased, so did the CPU load of the host machine (although top only showed the CPU was used at less than 10%).
Analysis
It was obvious that the system was busy waiting for IO (network or disk) BUT how to go about finding out who was the culprit ?
- iotop reported minimal disk activity (by the VM that was receiving collectd messages), but very little compared to what the system could handle. I couldn’t see how those writes would block.
- network traffic was quiet, except a little spike every minute when the collectd messages were passed, not much happening, again, nothing that should block.
The highest consumers of CPU (percentage, not load) were the three qemu-system-x86_64 processes. Decided to strace the highest consumer:
strace -s1024 -f -p 20101 > collectd.strace 2>&1
Checking the collectd.strace, it was littered with:
...
[pid 20101] ppoll([{fd=3, events=POLLIN}, {fd=5, events=POLLIN}, {fd=7, events=POLLIN}, {fd=8, events=POLLIN}, {fd=13, events=POLLIN}, {fd=15, events=POLLIN}, {fd=21, events=POLLIN}, {fd=26, events=POLLIN}], 8, {tv_sec=0, tv_nsec=3688384}, NULL, 8 <unfinished ...>
[pid 20101] <... ppoll resumed> ) = 0 (Timeout)
[pid 20101] ppoll([{fd=3, events=POLLIN}, {fd=5, events=POLLIN}, {fd=7, events=POLLIN}, {fd=8, events=POLLIN}, {fd=13, events=POLLIN}, {fd=15, events=POLLIN}, {fd=21, events=POLLIN}, {fd=26, events=POLLIN}], 8, {tv_sec=0, tv_nsec=0}, NULL, 8) = 0 (Timeout)
[pid 20101] ppoll([{fd=3, events=POLLIN}, {fd=5, events=POLLIN}, {fd=7, events=POLLIN}, {fd=8, events=POLLIN}, {fd=13, events=POLLIN}, {fd=15, events=POLLIN}, {fd=21, events=POLLIN}, {fd=26, events=POLLIN}], 8, {tv_sec=0, tv_nsec=927000000}, NULL, 8
...
Checking the file descriptors:
ls -al /proc/20101/fd

...
lrwx------. 1 qemu qemu 64 Apr 20 22:12 3 -> anon_inode:[signalfd]
lrwx------. 1 qemu qemu 64 Apr 20 22:12 4 -> anon_inode:[eventpoll]
lrwx------. 1 qemu qemu 64 Apr 20 22:12 5 -> anon_inode:[eventfd]
lrwx------. 1 qemu qemu 64 Apr 20 22:12 6 -> anon_inode:[eventpoll]
lrwx------. 1 qemu qemu 64 Apr 20 22:12 7 -> anon_inode:[eventfd]
lrwx------. 1 qemu qemu 64 Apr 20 22:12 8 -> anon_inode:[eventfd]
...
At first glance, there were many calls to file descriptors that represented eventfd. Started looking on Google to understand what this is needed for and very shortly found this presentation: Applying Polling Techniques to QEMU. Shortly, the qemu polling was ancient but there is a new kid on the block, the aio=native that solves the old problems. Hmmmm
aio=native is available since qemu 2.9.0 and my installed version is:
# qemu-system-x86_64 --version
QEMU emulator version 2.9.1(qemu-2.9.1-2.fc26)
Copyright (c) 2003-2017 Fabrice Bellard and the QEMU Project developers
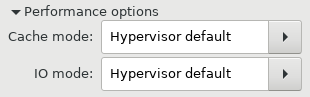
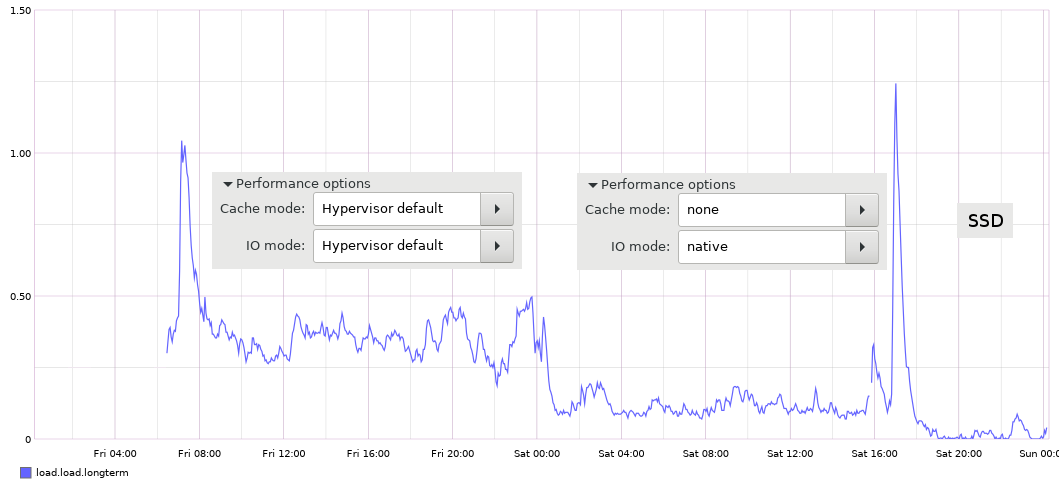
Going over the virtual machines, all the disks were defined as IDE and under Performance Tab the “Cache Mode” was “Hypervisor default” and “IO Mode” was also “Hypervisor default”:
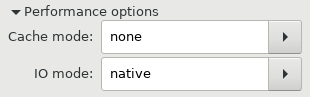
I decided to switch them to “Cache mode”: none and “IO mode”: native
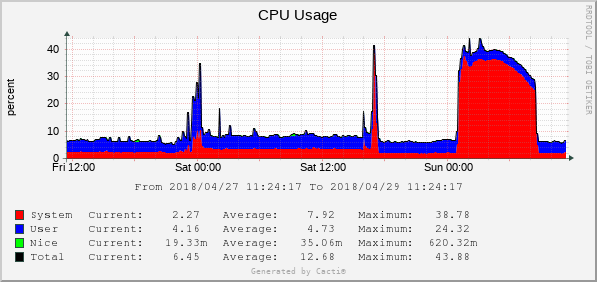
and lo and behold, the average load dropped from 0.40 down to 0.20, very nice!
Aftermath
Besides qemu-system-x86_64 one of the other CPU hogs was md0_raid5. In theory, the RAID disks should be kept as idle as possible and I decided to buy an SSD and move the VM images off the RAID onto the SSD. Few hours later, the system has stabilized to almost 0 for the 15minute average – yey!:
Conclusion
Problem solved by aio=native,cache=none for each virtual machine.
Further investigations
Try out other type of caching (instead of none) – and measure differences.
Ashley
Thank you for this well explained article!!
Never use RAID 5, not for anything.
RAID 5 is super slow!! Everything about it is slow.
Use RAID 10, or 1.
View document by BAARF to see why.
http://www.baarf.dk/BAARF/BAARF2.html
Mike Hardy
Emulating macOS via OSX-KVM and ran in to this just now on a config that worked on a previous machine (it’s always something right?)
Unfortunately while my symptoms where the same (a seemingly infinite loop on a ppoll syscall returning timeout, and file descriptors mostly eventfd though a couple sockets as well…) I was unable to reduce load by changing disks to aio=native,cache=none
I think there is something else going on then, either with the sockets being polled or the net tap device being polled, but either way I’m still burning an entire core on the VM, frustrating!
viulian
I’m sorry then that it didn’t work out for you, there are many possible cases, one that also took me a while to figure out were the login screen of the VMs. With a modern Linux, the login screens were using CPU cycles just for the cursor blinking – so I had to use more lightweight login screens. You may also want to investigate timer issues, some ways of keeping time in sync in the VM may trigger higher loads. I hope you can identify the cause of the issues.