Introduction
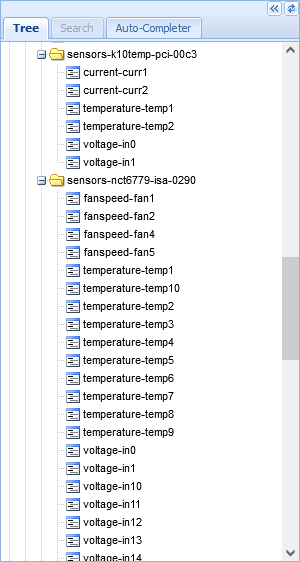
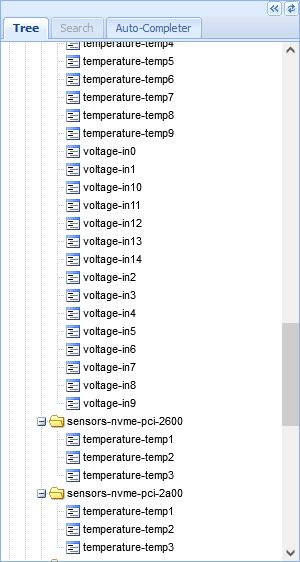
Charting sensor data using collectd is a breeze, however the sensor names end up being hard to decipher on an AsRock X470D4U motherboard. Can you tell which one is the CPU Temperature ?
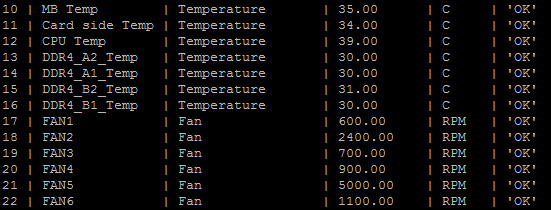
I decided to install the freeipmi library on Fedora to poke around and the output of ipmi-sensors is very readable:
Reading IPMI sensors
Initially I have tried configuring the ipmi plugin for collectd, but it would crash upon start: https://bugzilla.redhat.com/show_bug.cgi?id=1927022
Output could be parsed using a shell script plugged into the exec plugin, but the exec plugin tries to forbid running scripts as root; in case you need it (and ipmi-sensors requires root) then you have to add a new user to your system and force that user to have gid 0.
Reading IPMI sensor values with Perl
perl plugin does run scripts as root. Thus, I decided to write a small Perl script to parse the output and push the ‘Temperature’, ‘Fan’ and ‘Voltage’ sensor readings to Graphite. Perl (and Python) plugins do run their scripts are root.
It needs perl-Collectd package being installed (Fedora 33) as well as the freeipmi package (provides ipmi-sensors), then activating the perl plugin and configuration in collectd.conf to point to the script:
LoadPlugin perl
...
<Plugin perl>
        IncludeDir "/usr/lib64/collectd"
        BaseName "Collectd::Plugins"
#       EnableDebugger ""
        LoadPlugin IpmiSensors

        <Plugin IpmiSensors>
        </Plugin>
</Plugin>
The file needs to be saved to /usr/lib64/collectd/Collectd/Plugins/IpmiSensors.pm
# /usr/lib64/collectd/Collectd/Plugins/IpmiSensors.pm
#
# A Perl plugin script to help parsing ipmi-sensors output.
#
# Written by viulian
#
# This is free software; you can redistribute it and/or modify it under
# the terms of the GNU General Public License as published by the Free
# Software Foundation; only version 2 of the License is applicable.

# Notes:
# - freeipmi library is needed (providing ipmi-sensors executable)
# - perl-Collectd.x86_64 must be installed

package Collectd::Plugin::IpmiSensors;

use strict;
use warnings;

use Collectd qw( :all );

# Variables

# This code is executed after loading the plugin to register it with collectd.
plugin_register (TYPE_LOG, 'IpmiSensors', 'my_log');
plugin_register (TYPE_NOTIF, 'IpmiSensors', 'my_notify');
plugin_register (TYPE_INIT, 'IpmiSensors', 'my_init');
plugin_register (TYPE_READ, 'IpmiSensors', 'my_read');
plugin_register (TYPE_WRITE, 'IpmiSensors', 'my_write');
plugin_register (TYPE_SHUTDOWN, 'IpmiSensors', 'my_shutdown');
plugin_register (TYPE_CONFIG, 'IpmiSensors', 'my_config');

# For each of the functions below see collectd-perl(5) for details about
# arguments and the like.

sub my_config {
        1;
} # my_config ()

# This function is called once upon startup to initialize the plugin.
sub my_init
{
        return 1;
} # my_init ()

# This function is called in regular intervals to collectd the data.
sub my_read
{
        my @stdout = qx/\/usr\/sbin\/ipmi-sensors --ignore-not-available-sensors --no-header-output --comma-separated-output/;

        for (@stdout) {
            chomp();
            my @spl = split(',', $_);
            # 1,3VSB,Voltage,3.38,V,'OK'

            my $type;
            if ($spl[2] eq 'Temperature') {
                    $type = 'temperature';
            } elsif ($spl[2] eq 'Voltage') {
                    $type = 'voltage';
            } elsif ($spl[2] eq 'Fan') {
                    $type = 'fanspeed';
            } else {
                    next; # not caring about anything else now; WARN may litter logs.
            }

            my $type_instance = $spl[1];
            # sanitize a bit (replace spaces and dots by _)
            $type_instance =~ s/\ /_/g;
            $type_instance =~ s/\./_/g;
            $type_instance = lc($type_instance);

            # ready to ship
            my $vl = {};
            $vl->{'values'} = [ $spl[3] ];
            $vl->{'plugin'} = 'ipmi-sensors';
            # $vl->{'plugin_instance'} = 'instance';
            $vl->{'type'} = $type;
            $vl->{'type_instance'} = $type_instance;

            plugin_dispatch_values($vl)
        }

        # A false return value indicates an error and the plugin will be skipped
        # for an increasing amount of time.
        return 1;
} # my_read ()

# This function is called after values have been dispatched to collectd.
sub my_write
{
        return 1;
} # my_write()

# This function is called before shutting down collectd.
sub my_shutdown
{
        return 1;
} # my_shutdown ()

# This function is called when plugin_log () has been used.
sub my_log
{
        return 1;
} # my_log ()

# This function is called when plugin_dispatch_notification () has been used
sub my_notify
{
        return 1;
} # my_notify ()
Results
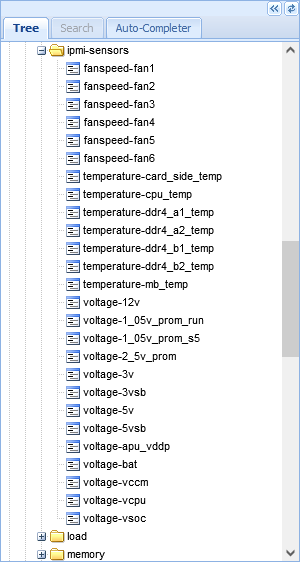
As you can see below, the measurements reflect the name of the sensors and the whole thing is very much readable.
The chart with CPU and Motherboard temperatures:
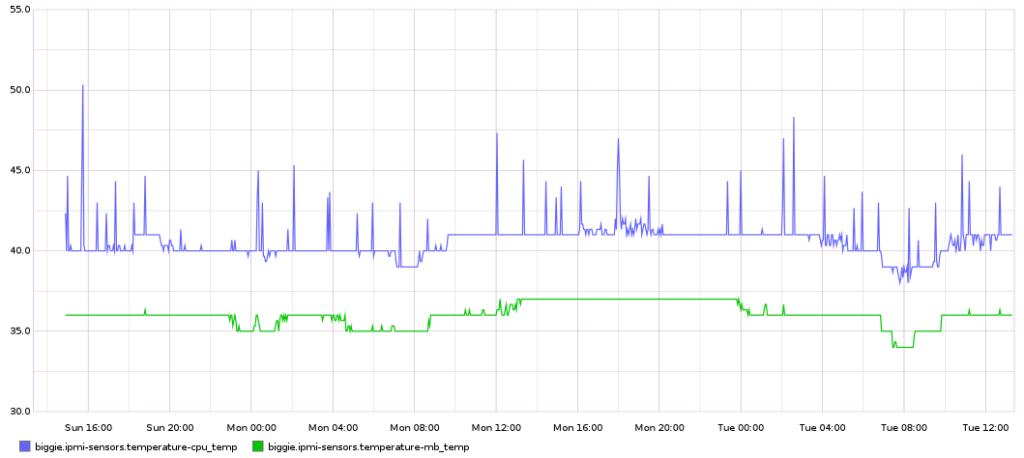
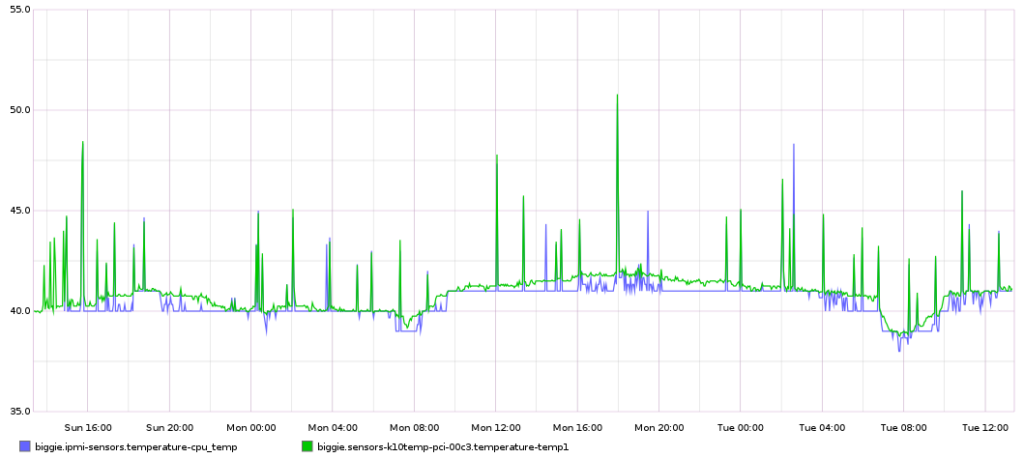
An interesting thing to note is that it seems that the IPMI temperatures for the CPU are rounded up(or down) to 0.5C. I was able to identify the corresponding CPU sensors into the output of the sensors plugin: the value provided by the sensors plugin is much more accurate (sensors plugin output is in green, IPMI in blue):
Hope this is useful,

Leave a Reply