Introduction
I use 4 Atlas Scientific pH Circuits (v 5.0) with a Multi Circuit Carrier Board to monitor de pH in 4 of my aquariums.
The Atlas Scientific pH Circuit can be calibrated following a simple procedure described in the manual: you should put the circuit on continuous sampling, then submerge the probe under pH 7, wait for it to stabilize, then clean and whipe the probe, and continue with pH 4 and pH 10 sample.
However, I didn’t choose to follow this procedure because:
a) even if I now have it, it was difficult to find a pH solution of reference 10. What the shops nearby would get me was pH 9 calibration, which can’t be used for pH Circuit (v5.0 – don’t know about the newer versions ?).
b) the way I designed my monitoring made it a bit more difficult to put a pH circuit ‘offline’ while I was calibrating it. It is not problem though, I had a solution figured out anyway – and it is even more flexible, as you will see below.
First, I was able to estimate what mV the probe was putting out just by looking at the pH value. pH Circuit is very versatile … and no problems so far. I have an older article here: http://hex.ro/wp/blog/ph-electrode-mv-output-using-an-atlas-scientific-ph-circuit/
Setup
If the pH Circuit is set to run at T = 25C, then the mV output of the probe seems to be calculated using the formula:
mV = 59.2 * (7 - pH_output)
Calibrating through pH Circuit give you the possibility to compensate the pH based on the temperature too, but in the explanations below I’ve simplified and assumed T = 25C – the temperature of the water in the aquariums is already around 25C.
The example below is for one probe, the output in mV is calculated using the formula above.
| pH Solution | pH Circuit output | Probe output (mV) |
| 4 | 3.93 | 181.744 |
| 7 | 7.20 | -11.84 |
| 10 | 10.37 | -199.504 |
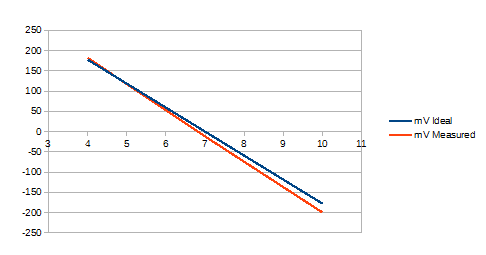
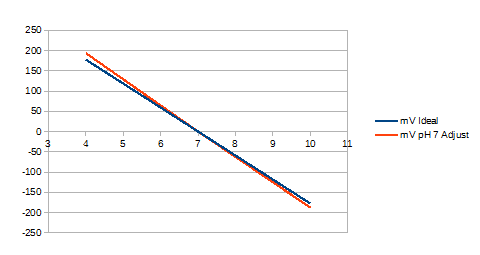
Plotting the values above on a chart next to an ideal pH probe output:
As you can see, for pH 7, an ideal probe would register 0mV, but mine seems to register already -11.84mV. To make more sense of the graph, we need to shift he values up with -11.84mV (which is considering calibrating for pH 7. By the way, that’s why I suppose it is also recommended as the initial value to start calibrating with.
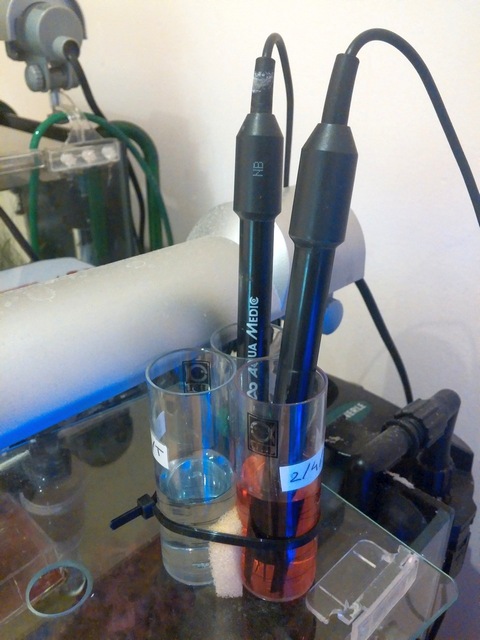
With this “post measuring” calibration approach (as opposed to delegating to pH Circuit to do it) we don’t really care about the order of pH samples the probes are submerged into; This way, you can calibrate 2 at a time (even 3) using the small calibration device (in the photo on top).
After shifting the values up with 11.84mV, the chart now looks like this:
| pH Solution | pH 7 calibrated (mV) |
| 4 | 181.744 + 11.84 = 193.584 |
| 7 | -11.84 + 11.84 = 0 |
| 10 | -199.504 + 11.84 = -187.664 |
If the ideal pH probe output is a line, in my case, the measured values are not on a line. The output diverges faster (towards the left) than it diverges towards the right. Now, there are few ideas on how to approximage the real pH based on the pH reported by pH Circuit.
We could try to fit a line in between the ideal one and the real one (and use that to ‘walk back’ to the real pH value). I chose a different idea:
a) assumed that the pH 4 -> pH 7 part is a line, different from the pH 7 -> pH 10 line.
b) that each line diverges proportionally (starting from pH 7) but at a different rate.
So for each mV to the left (or to the right), there has to be a conversion formula to multiply the value so that the result falls onto the ideal line (and thus producing the correct pH output from the pH Circuit).
The goal is to find a formula that will take the erroneous (uncalibrated) pH output and obtain a closer to reality (calibrated) value that we can then use.
The formula I came up with using the assumptions above (T=25C, and the aging pH probe doesn’t produce linear output continuously, but two linear outputs with different slopes):
pH_real = 7 - $coef * (7 - pH_circuit_value) + ( coef * shift_to_pH_7 / 59.2)
where:
pH_real is the value that we are interested in.
pH_circuit_value is the value that pH Circuit reports, uncalibrated.
shift_to_pH_7 is the value (in mV) that we need to compensate the graph at ph 7 (in the case above -11.84 mV)
coef is the coefficient that each (left or right) slope diverges from the ideal – (and chosen accordingly depending where the measured pH is found, to the left of ph 7, or to the right), for example:
left_coef = mV_4_ideal / (mV_4_circuit_value - shift_to_pH_7)
where: mv_4_circuit_value is the mV value calculated starting from the pH Circuit value (uncalibrated) when immersed in a pH 4 solution by applying the mV = 59.2 * (7 – pH_output) formula.
Summary
This calibration procedure above (software calibration) reduces a lot of time spent calibrating the pH Circuit. You don’t need to add the pH Circuit calibration commands to your controller, just allow for probe values to settle once inserted into the solution, then apply the algorithm!

Andres Snake
Good day.
Please tell me the command to calibrate 10 ph for the ph 5.0 board.
I found the documentation only for 4.0, all the commands came up except T/r. If you would share the dataset, I would be happy.
Thank you.
Andres Snake
you are my last hope to deal with this sensor, everything has been removed from the manufacturer’s website for a long time. Maybe it’s a problem connecting to the esp and the sensor does not give negative values. without calibration at 10, it does not show above 7, but the T command is confirmed by the LED, but ignores the calibration.
viulian
The T command is the right one to calibrate it. It should respond with “10.00”. But on why it hangs, I would not give up yet and try it with an Arduino, at least to confirm that the serial communication is not the problem.
Andres Snake
Thank you for such a good article with the given calculations and formulas.
I collect raw data (uncalibrated) from the sensor and find the square function from the readings in three buffer solutions.
I’m not very proficient with Arduino. I send commands through ESPHome and the HomeAssistant smart home. Even after the \X reset command, the \F and \S commands are sent in any (4,7,10) buffer solution (to 4 and to 7). Data 4.00 or 7.00 begins to immediately appear in the log, but this situation does not work with \T, it does not notice the command and the log does not change.
The green LED confirms that the command has been accepted.
I’m stubborn and tried all the keys on the keyboard. When the command is suitable, it is accepted – the green LED, if not, then the red LED.
It also understands the \Z command, but I still don’t understand what it does.
viulian
I wasn’t remembering too many things about it, but I was able to find a copy of the datasheet here: http://www.codbyte.com.br/medidor-de-ph-com-arduino-uno-e-display-lcd/ (search for “data sheet”, there is a link). Also, the PDF clarifies (and is what I forgot) that you have to switch to continuous mode (command \C) before starting the calibration procedure, and wait few minutes before issuing each of the \S, then \F, then \T commands. It is mandatory to start with \S, then \F then finally \T.
Andres Snake
Thank you very much, I searched the entire Internet, I now understand what Z means))).
This sensor has been lying on the shelf for 10 years. Its raw data, even in solution 9, now shows about 6. In the aquarium, its data floats and the values slowly increase. 9.2 – 6.25; 7 – 5.43; 4 – 4.34.
I ordered a new sensor, the board is in order and let it work for the benefit of aquatic organisms. It is wrong to throw away old, working, reliable things. Thank you very much. Chip is work! 😉